 网硕互联帮助中心
文章目录
- 1. 动态批处理(Dynamic Batching)
- 2. 模型并发(Model Concurrency)
- 3. TensorRT加速
- 4. 测试
-
- 原始模型
- 动态批次
- 2个模型实例
- TensorRT优化
- 5. 模型分析
参考:
https://github.com/triton-inference-server/tutorials/tree/main/Conceptual_Guide/Part_2-improving_resource_utilization
https://github.com/triton-inference-server/tutorials/tree/main/Conceptual_Guide/Part_3-optimizing_triton_configuration
NVIDIA的Triton推理服务器通过动态批处理、模型并发和TensorRT加速等多种优化策略,不仅充分发挥GPU的并行计算能力,还能根据业务场景灵活调整配置,从而实现高吞吐、低延迟的推理服务。本文将深入解析Triton中的关键优化技术,并结合详细的测试数据和命令行解析,为读者展示如何利用这些技术提升推理性能。
1. 动态批处理(Dynamic Batching)
在实际推理场景中,单个请求往往无法充分利用GPU的计算能力。动态批处理技术通过将多个推理请求合并成一个批次进行处理,有效提升了GPU的并行运算效率。关键在于平衡吞吐量和延迟:
-
吞吐量:合并请求后可在一次推理中处理更多数据,从而提高每秒完成的推理数量。
-
延迟:等待批次组建时间可能带来一定的延迟,通过调整max_queue_delay_microseconds参数可以控制最大等待时长,实现低延迟与高吞吐间的折中。
-
优势:减少GPU空闲时间,提升吞吐量。
-
适用场景:高并发推理任务。
需在模型配置中加上以下内容
dynamic_batching {
max_queue_delay_microseconds: 100 # 空字典,表示没有延迟
}
2. 模型并发(Model Concurrency)
在实际部署时,往往会存在多个模型同时运行的情况。Triton通过在同一GPU上运行多个模型实例(instance),实现模型并发。通过合理的资源分配,可以防止单一模型独占GPU资源,进而满足多任务并行推理需求。
- 优势:提高GPU利用率,减少资源浪费。
- 适用场景:多模型推理任务。
需在模型配置中加上以下内容
instance_group [
{
count: 2 # 模型实例的数量
kind: KIND_GPU # 使用GPU
gpus: [0] # 指定GPU设备ID
}
]
3. TensorRT加速
TensorRT 是NVIDIA专为深度学习推理设计的高性能优化库。通过将模型转换为TensorRT引擎,能够借助FP16等低精度运算模式,显著提升推理速度,并降低延迟。但需要注意的是,引擎的编译过程可能较耗时(本文中大约15分钟)
需在模型配置中加上以下内容
optimization {
execution_accelerators {
gpu_execution_accelerator : [ {
name : “tensorrt”
parameters { key: “precision_mode” value: “FP16” }
parameters { key: “max_workspace_size_bytes” value: “1073741824” }
}]
}
}
- 优势:显著提高推理速度,降低计算延迟,同时充分利用GPU硬件特性。
- 适用场景:对延迟敏感且要求高吞吐的推理任务,尤其是在对精度要求允许适当降低时。
4. 测试
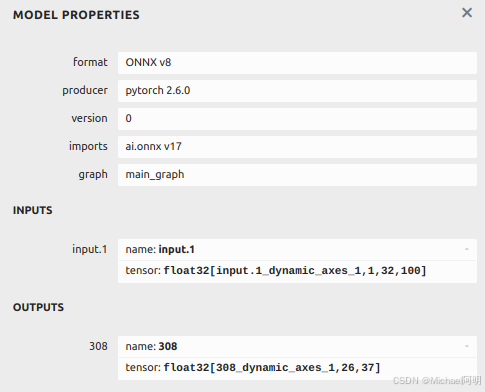
对 使用triton部署OCR服务(一) 中的 文本识别模型,导出动态批次的onnx模型
trace_input = torch.randn(1, 1, 32, 100)
torch.onnx.export(model, trace_input, "str.onnx", verbose=True, dynamic_axes={'input.1':[0],'308':[0]})
启动 tritonserver
tritonserver ––model–repository=./model_repository/
进入推理客户端的容器
docker run –it ––net=host –v ${PWD}:/workspace/ nvcr.io/nvidia/tritonserver:24.10–py3–sdk bash
进行测试,测试命令如下:
perf_analyzer –m text_recognition –b 2 ––shape input.1:1,32,100 ––concurrency–range 2:16:2 ––percentile=95
- 参数说明:
- -m text_recognition:指定要测试的模型名称。
- -b 2:指定batch size为2。
- –shape input.1:1,32,100:设置输入数据的形状。
- –concurrency-range 2:16:2:测试并发请求数从2到16,步长为2。
- –percentile=95:统计95%分位延迟(p95 latency),反映大部分请求的延迟情况。
在测试输出中,常见指标包括:
- Throughput (infer/sec):每秒处理的推理数量,越高表示吞吐量越好。
- p95 Latency (usec):95百分位延迟,反映大部分请求的响应时间。
- Avg HTTP Time (usec):平均HTTP响应时间,包括请求发送、等待和接收数据的总耗时。
- Queue、Compute Infer:分别代表请求排队等待和实际计算推理的耗时,帮助定位瓶颈。
*** Measurement Settings ***
Batch size: 2
Service Kind: TRITON
Using "time_windows" mode for stabilization
Stabilizing using p95latency and throughput
Measurement window: 5000 msec
Latency limit: 0 msec
Concurrency limit: 16 concurrent requests
Using synchronous calls for inference
Request concurrency: 2
Client:
Request count: 6112
Throughput: 678.775 infer/sec
p50 latency: 5880 usec
p90 latency: 5935 usec
p95 latency: 5959 usec
p99 latency: 6042 usec
Avg HTTP time: 5884 usec (send/recv 17 usec + response wait 5867 usec)
Server:
Inference count: 12226
Execution count: 6113
Successful request count: 6113
Avg request latency: 5806 usec (overhead 9 usec + queue 2866 usec + compute input 8 usec + compute infer 2916 usec + compute output 5 usec)
省略其他并发数4、6、8、。。。16 的结果
Inferences/Second vs. Client p95 Batch Latency
Concurrency: 2, throughput: 678.775 infer/sec, latency 5959 usec
Concurrency: 4, throughput: 679.345 infer/sec, latency 11859 usec
Concurrency: 6, throughput: 677.233 infer/sec, latency 17827 usec
Concurrency: 8, throughput: 674.897 infer/sec, latency 24056 usec
Concurrency: 10, throughput: 675.966 infer/sec, latency 29906 usec
Concurrency: 12, throughput: 676.23 infer/sec, latency 35703 usec
Concurrency: 14, throughput: 667.567 infer/sec, latency 43738 usec
Concurrency: 16, throughput: 676.548 infer/sec, latency 47543 usec
原始模型
- 随着并发数的增加,虽然Throughput基本保持稳定,但p95 Latency明显上升,说明高并发下请求等待时间增加。
- Queue时间在并发数较高时急剧增大,成为性能瓶颈。
| 2 | 678.775 | 5959 | 5884 | 12226 | 6113 | 6113 | 2866 | 2916 |
| 4 | 679.345 | 11859 | 11765 | 12232 | 6116 | 6116 | 8743 | 2915 |
| 6 | 677.233 | 17827 | 17705 | 12196 | 6098 | 6098 | 14670 | 2924 |
| 8 | 674.897 | 24056 | 23689 | 12152 | 6076 | 6076 | 20629 | 2932 |
| 10 | 675.966 | 29906 | 29567 | 12174 | 6087 | 6087 | 26515 | 2929 |
| 12 | 676.23 | 35703 | 35466 | 12176 | 6088 | 6088 | 32416 | 2928 |
| 14 | 667.567 | 43738 | 41920 | 12020 | 6010 | 6010 | 38786 | 2957 |
| 16 | 676.548 | 47543 | 47274 | 12182 | 6091 | 6091 | 44231 | 2927 |
动态批次
- 动态批处理在低并发时与原始模型相近,但在中高并发时明显提高了吞吐量(例如并发4时从679 infer/sec提升到955 infer/sec),同时控制延迟在一定范围内。
- 数据表明动态批次能够在请求合并上起到平滑效应,从而改善排队时间。
| 2 | 672.357 | 6082 | 5940 | 12108 | 6054 | 6054 | 2881 | 2940 |
| 4 | 955.458 | 8460 | 8361 | 17210 | 4303 | 8605 | 3496 | 4710 |
| 6 | 1089.44 | 11112 | 11005 | 19624 | 3271 | 9812 | 4923 | 5892 |
| 8 | 1165.81 | 13866 | 13712 | 20988 | 2624 | 10494 | 6722 | 6785 |
| 10 | 1167.68 | 20604 | 17115 | 21032 | 2629 | 10516 | 10139 | 6779 |
| 12 | 1166.44 | 20706 | 20565 | 21008 | 2626 | 10504 | 13574 | 6785 |
| 14 | 1166.79 | 27497 | 23986 | 21016 | 2627 | 10508 | 16986 | 6785 |
| 16 | 1163.36 | 27643 | 27482 | 20960 | 2620 | 10480 | 20474 | 6801 |
2个模型实例
- 通过在同一GPU上启用多实例,使得在一定程度上分摊了请求压力,但由于实例间资源共享,部分指标(如p95 Latency)仍有提升。
- 对于需要同时服务多个模型的场景,该配置有助于整体资源利用率的均衡调度。
| 2 | 569.779 | 8289 | 7008 | 10260 | 5014 | 5130 | 44 | 6802 |
| 4 | 752.538 | 13205 | 10618 | 13552 | 5084 | 6776 | 3343 | 7081 |
| 6 | 1028.35 | 14059 | 11660 | 18524 | 4639 | 9262 | 3631 | 7818 |
| 8 | 1207.52 | 15719 | 13240 | 21748 | 4077 | 10874 | 4144 | 8860 |
| 10 | 1258.8 | 17625 | 15872 | 22678 | 3405 | 11339 | 5016 | 10611 |
| 12 | 1323.27 | 20152 | 18125 | 23834 | 2989 | 11917 | 5942 | 11931 |
| 14 | 1324.09 | 25018 | 21130 | 23848 | 2986 | 11924 | 8936 | 11935 |
| 16 | 1329.37 | 25325 | 24053 | 23944 | 2993 | 11972 | 11890 | 11918 |
TensorRT优化
- TensorRT加速显著提升了Throughput,最低并发情况下吞吐量达到 2901 infer/sec,且p95 Latency大幅降低。
- 这种优化对需要极致性能的场景尤为重要,但需额外考虑引擎编译时间(首次启动时)
| 2 | 2901.05 | 1446 | 1370 | 104628 | 52175 | 52314 | 11 | 1260 |
| 4 | 3927.45 | 2430 | 2029 | 141700 | 53153 | 70850 | 601 | 1339 |
| 6 | 5176.24 | 2725 | 2311 | 186950 | 46747 | 93475 | 646 | 1555 |
| 8 | 5741.21 | 3052 | 2778 | 207494 | 38908 | 103747 | 813 | 1829 |
| 10 | 6273.42 | 3417 | 3183 | 227526 | 34139 | 113763 | 934 | 2083 |
| 12 | 6750.45 | 3740 | 3546 | 246574 | 30826 | 123355 | 1082 | 2290 |
| 14 | 6640.54 | 4752 | 4209 | 241978 | 30252 | 120989 | 1711 | 2315 |
| 16 | 5978.15 | 4789 | 5328 | 230884 | 28865 | 115442 | 2707 | 2361 |
通过上述对比可以看出:
- 吞吐量:TensorRT优化在所有配置中均大幅领先;动态批次在中等并发下也有较好的表现;
- 延迟:TensorRT不仅提升了吞吐量,还使延迟降至最低;原始模型在并发增大时延迟急剧上升,动态批次则较为平稳;
- 队列等待:动态批处理和TensorRT优化均有效降低了请求排队时间。
5. 模型分析
为了全面评估不同配置下的模型表现,NVIDIA提供了triton-model-analyzer 工具。该工具可以自动化执行多组参数的网格搜索,并生成详细报告。
pip install triton–model–analyzer
编写 perf.yaml 测试配置,可以指定优化目标、优化约束 参考:https://github.com/triton-inference-server/model_analyzer/blob/main/docs/config.md#config-options-for-profile
run_config_search_disable: False
profile_models:
text_recognition:
perf_analyzer_flags:
percentile: 99
model_config_parameters:
max_batch_size: 2
dynamic_batching:
max_queue_delay_microseconds: [0, 200]
instance_group:
– – kind: KIND_GPU
count: 1
– – kind: KIND_CPU
count: 1
parameters:
concurrency:
start: 2
stop: 10
step: 2
batch_sizes: 1,2,3
objectives:
– perf_latency_p99
– gpu_utilization
constraints:
perf_latency_p99:
max: 10
perf_throughput:
min: 3000
执行参数网格搜索,并统计模型的表现
model-analyzer profile –model-repository ./model_repository \\
–triton-launch-mode=local \\
–output-model-repository-path ./model_analyzer_output/ \\
-f ./Part_2-improving_resource_utilization/perf.yaml \\
–override-output-model-repository \\
–latency-budget 10
会生成一个报告,报告显示各配置的模型的表现 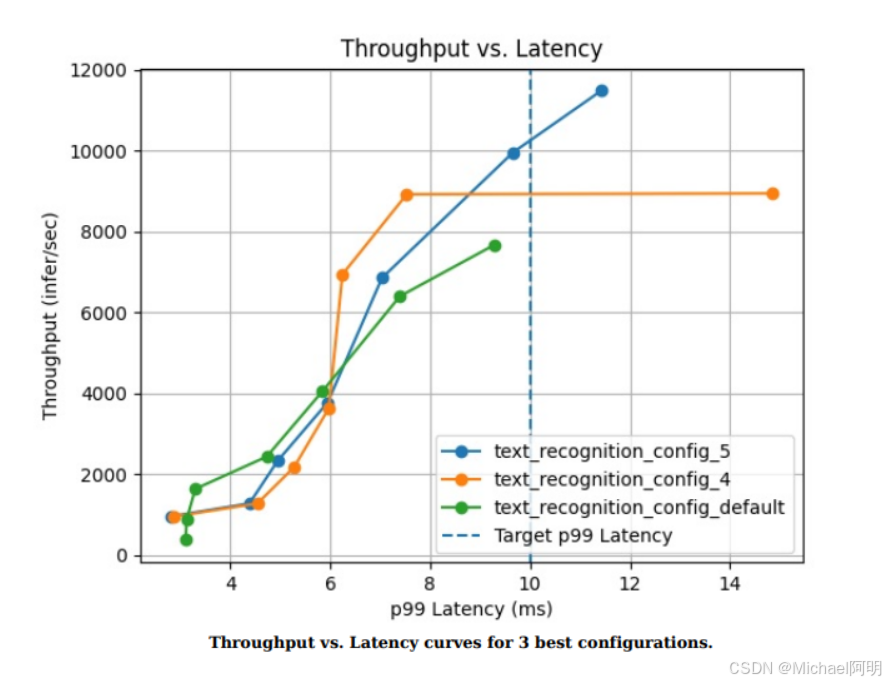
生成各个配置模型的详细报告
model-analyzer report –report-model-configs text_recognition_config_0,text_recognition_config_1,text_recognition_config_2,text_recognition_config_3,text_recognition_config_default \\
–export-path ./model_analyzer_report \\
–config-file ./Part_2-improving_resource_utilization/perf.yaml


评论前必须登录!
注册