 网硕互联帮助中心
我们在查看服务器运行状态时,除了使用命令行还是命令行。那么有什么办法可以不用命令行,直观地查看服务器的CPU、内存、网络、容器运行状态等信息呢?今天给大家分享一款好用的服务器监控工具Sampler,使用它能快速方便地查看这些信息,希望对大家有所帮助!
Sampler简介
Sampler是一款基于shell命令的可视化监控工具,通过简单的YAML文件来进行配置即可实现监控,目前在Github上已有12k+Star。下面是使用Sampler来进行服务器状态监控的效果图,看起来还是挺炫酷的! 
安装
Sampler的安装非常简单,这里以Linux系统为例,使用如下命令下载Sampler的安装包;
# 下载sampler的安装包保存到/usr/local/bin目录下
sudo wget https://github.com/sqshq/sampler/releases/download/v1.1.0/sampler-1.1.0-linux-amd64 –O /usr/local/bin/sampler
# 给安装包添加执行权限
sudo chmod +x /usr/local/bin/sampler
安装完成后在/usr/local/bin目录下,就有一个可执行的sampler文件了。 
使用
Sampler的使用非常简单,只要在yaml文件中配置好监控脚本,然后使用如下命令执行即可;
# 配置文件需要添加可执行权限
chmod +x config.yml
# 然后通过配置文件启动Sampler
sampler –c config.yml
如果你想查看服务器CPU和可用内存情况,可以在config.yml文件中添加如下脚本,然后使用上面的命令来运行;
sparklines:
– title: CPU usage(%)
rate-ms: 200
scale: 0
sample: ps –A –o %cpu | awk '{s+=$1} END {print s}'
– title: RAM free(MB)
rate-ms: 200
scale: 0
sample: free –m| grep "Mem:" | awk '{print $4}'
执行命令后,显示效果如下:  如果你想查看服务器上Docker容器的运行状态,可以添加如下脚本;
textboxes:
– title: Docker containers stats
rate-ms: 500
sample: docker stats —no-stream —format "table {{.Name}}\\t{{.CPUPerc}}\\t{{.MemUsage}}\\t{{.PIDs}}"
执行命令后,显示效果如下:  如果你想查看服务器的网络状态,例如UDP和TCP的收发情况,可以添加如下脚本;
barcharts:
– title: Local network activity
rate-ms: 500
scale: 0
items:
– label: UDP bytes in
sample: netstat –anu | awk '{sum += $2} END {print sum}'
– label: UDP bytes out
sample: netstat –anu | awk '{sum += $3} END {print sum}'
– label: TCP bytes in
sample: netstat –ant | awk '{sum += $2} END {print sum}'
– label: TCP bytes out
sample: netstat –ant | awk '{sum += $3} END {print sum}'
执行命令后,显示效果如下: 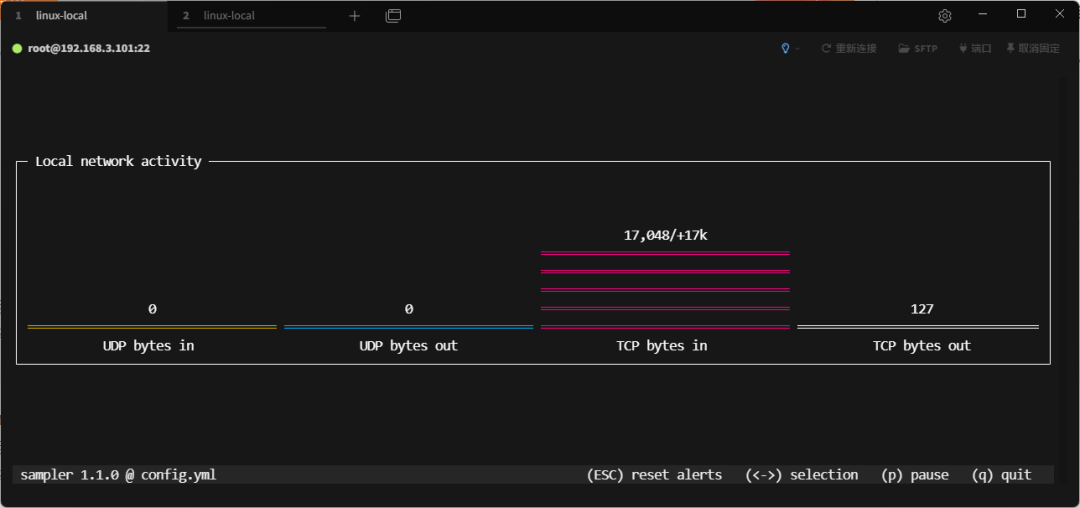 如果你想查看服务器的时间,可以添加如下脚本;
asciiboxes:
– title: CST time
rate-ms: 500
font: 2d
border: false
color: 43
sample: env TZ=Asia/Shanghai date +%r
执行命令后,显示效果如下: 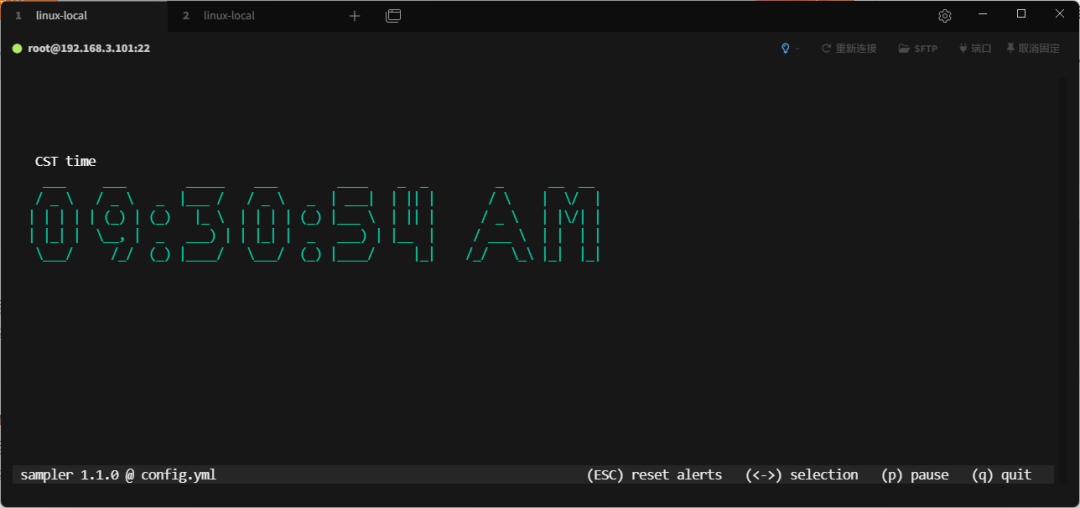 我们再把上面这些监控信息组合起来,制作一个面板来看下效果,还是挺炫酷的;
  这里使用的脚本如下,感兴趣的小伙伴可以尝试下!
runcharts:
– title: Search engine response time
position: [[0, 0], [45, 19]]
rate-ms: 500
triggers:
– title: Latency threshold exceeded
condition: echo "$prev < 0.8 && $cur > 0.8" |bc –l
actions:
terminal-bell: true
sound: true
visual: true
script: 'say alert: ${label} latency exceeded ${cur} second'
legend:
enabled: true
details: false
scale: 2
items:
– label: BAIDU
color: 178
sample: curl –o /dev/null –s –w '%{time_total}' https://www.baidu.com
– label: BING
sample: curl –o /dev/null –s –w '%{time_total}' https://www.bing.com
barcharts:
– title: Local network activity
position: [[45, 20], [35, 8]]
rate-ms: 500
scale: 0
items:
– label: UDP bytes in
sample: netstat –anu | awk '{sum += $2} END {print sum}'
– label: UDP bytes out
sample: netstat –anu | awk '{sum += $3} END {print sum}'
– label: TCP bytes in
sample: netstat –ant | awk '{sum += $2} END {print sum}'
– label: TCP bytes out
sample: netstat –ant | awk '{sum += $3} END {print sum}'
gauges:
– title: YEAR PROGRESS
position: [[45, 0], [35, 2]]
cur:
sample: date +%j
max:
sample: echo 365
min:
sample: echo 0
– title: DAY PROGRESS
position: [[45, 3], [35, 2]]
cur:
sample: date +%H
max:
sample: echo 24
min:
sample: echo 0
– title: HOUR PROGRESS
position: [[45, 6], [35, 2]]
cur:
sample: date +%M
max:
sample: echo 60
min:
sample: echo 0
– title: MINUTE PROGRESS
position: [[45, 9], [35, 2]]
triggers:
– title: CLOCK BELL EVERY MINUTE
condition: '[ $label == "cur" ] && [ $cur -eq 0 ] && echo 1 || echo 0'
actions:
sound: true
script: say –v samantha `date +%I:%M%p`
cur:
sample: date +%S
max:
sample: echo 60
min:
sample: echo 0
sparklines:
– title: CPU usage
position: [[0, 20], [22, 8]]
rate-ms: 200
scale: 0
sample: ps –A –o %cpu | awk '{s+=$1} END {print s}'
– title: RAM free(MB)
position: [[22, 20], [23, 8]]
rate-ms: 200
scale: 0
sample: free –m | grep "Mem:" | awk '{print $4}'
textboxes:
– title: Docker containers stats
position: [[0, 29], [45, 10]]
rate-ms: 500
sample: docker stats —no-stream —format "table {{.Name}}\\t{{.CPUPerc}}\\t{{.MemUsage}}\\t{{.PIDs}}"
– title: Local weather
position: [[69, 31], [13, 7]]
rate-ms: 10000
sample: curl wttr.in?0ATQF
border: false
– title: New York weather
position: [[45, 31], [13, 7]]
rate-ms: 10000
sample: curl wttr.in/newyork?0ATQF
transform: echo 1
border: false
– title: San Francisco weather
position: [[56, 31], [13, 7]]
rate-ms: 10000
sample: curl wttr.in/sanfrancisco?0ATQF
border: false
asciiboxes:
– title: CST time
position: [[45, 12], [35, 7]]
rate-ms: 500
sample: env TZ=Asia/Shanghai date +%r
border: false
font: 2d
总结
今天给大家介绍了一款直观易用的服务器监控工具Sampler,使用它来查看服务器运行状态真的是一目了然。其实Sampler的功能不止于此,它还能用于监控MySQL、MongoDB、Kafka这类中间件的信息,该兴趣的小伙伴可以尝试下!
项目地址
https://github.com/sqshq/sampler


评论前必须登录!
注册